Reporting Dashboard
Track your team's sales performance, close rates, and revenue by viewing quotes, metrics, and activity trends across custom time periods
How to Use the Reporting Dashboard in SetSale
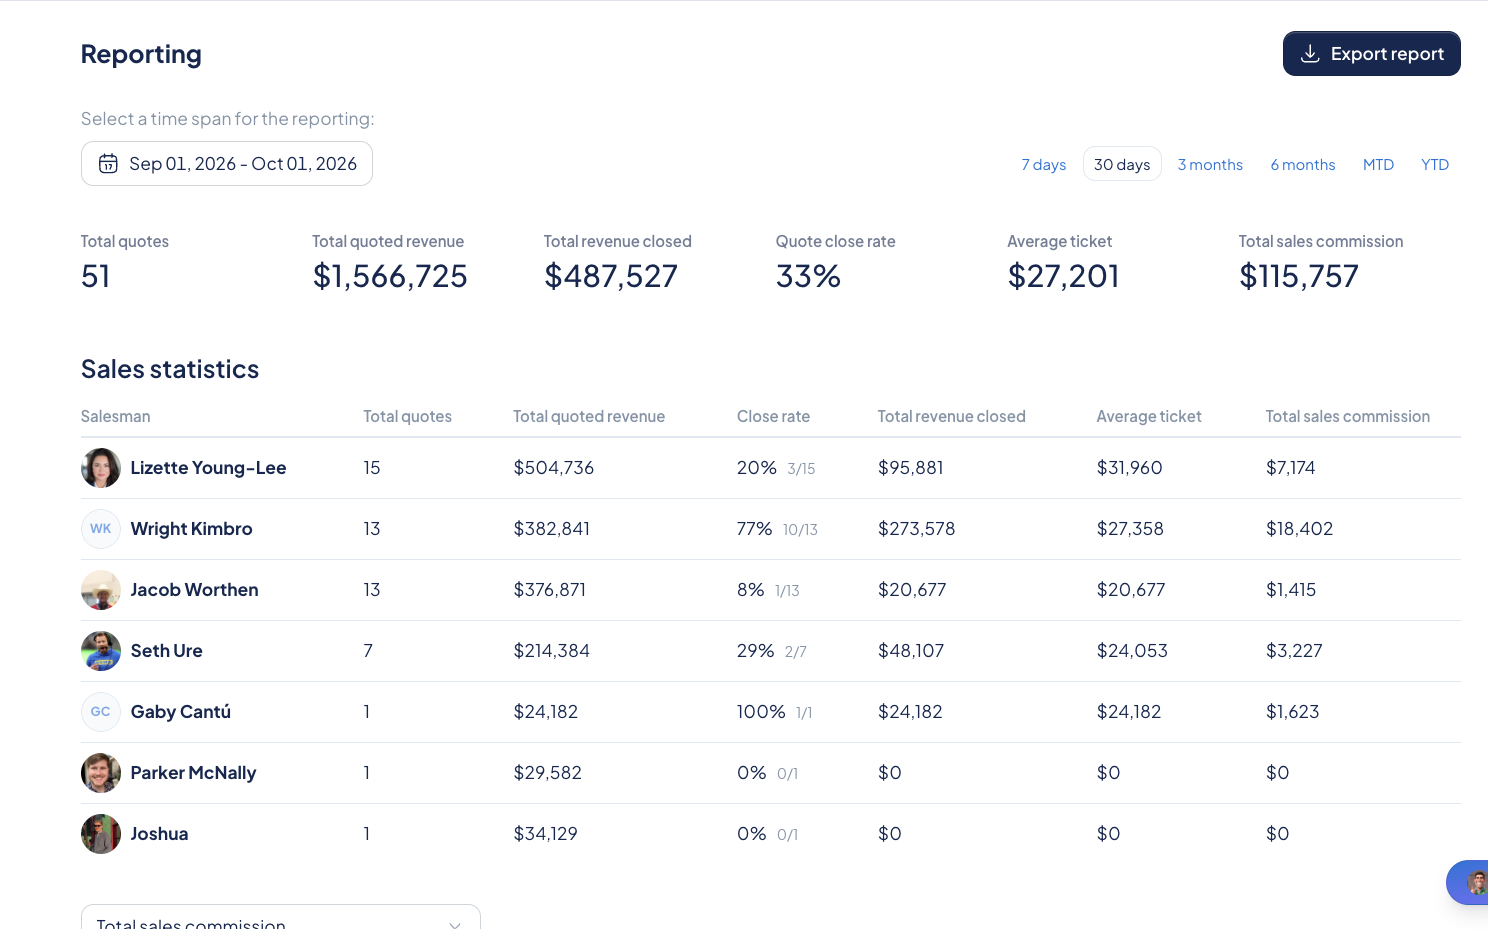
The Reporting Dashboard shows how your team is selling — how many quotes are going out, how many are closing, and who's driving revenue. Use it to spot trends, coach your salespeople, and see where your jobs are coming from.
Open the Reporting Dashboard
- Click Reporting in the left menu.
- The dashboard opens showing the last 30 days by default.
Choose a Time Span
Every number, table, and chart on the page updates to match the time span you pick.
- Quick filters: Click 7 days, 30 days, 3 months, 6 months, MTD (month to date), or YTD (year to date) in the top right.
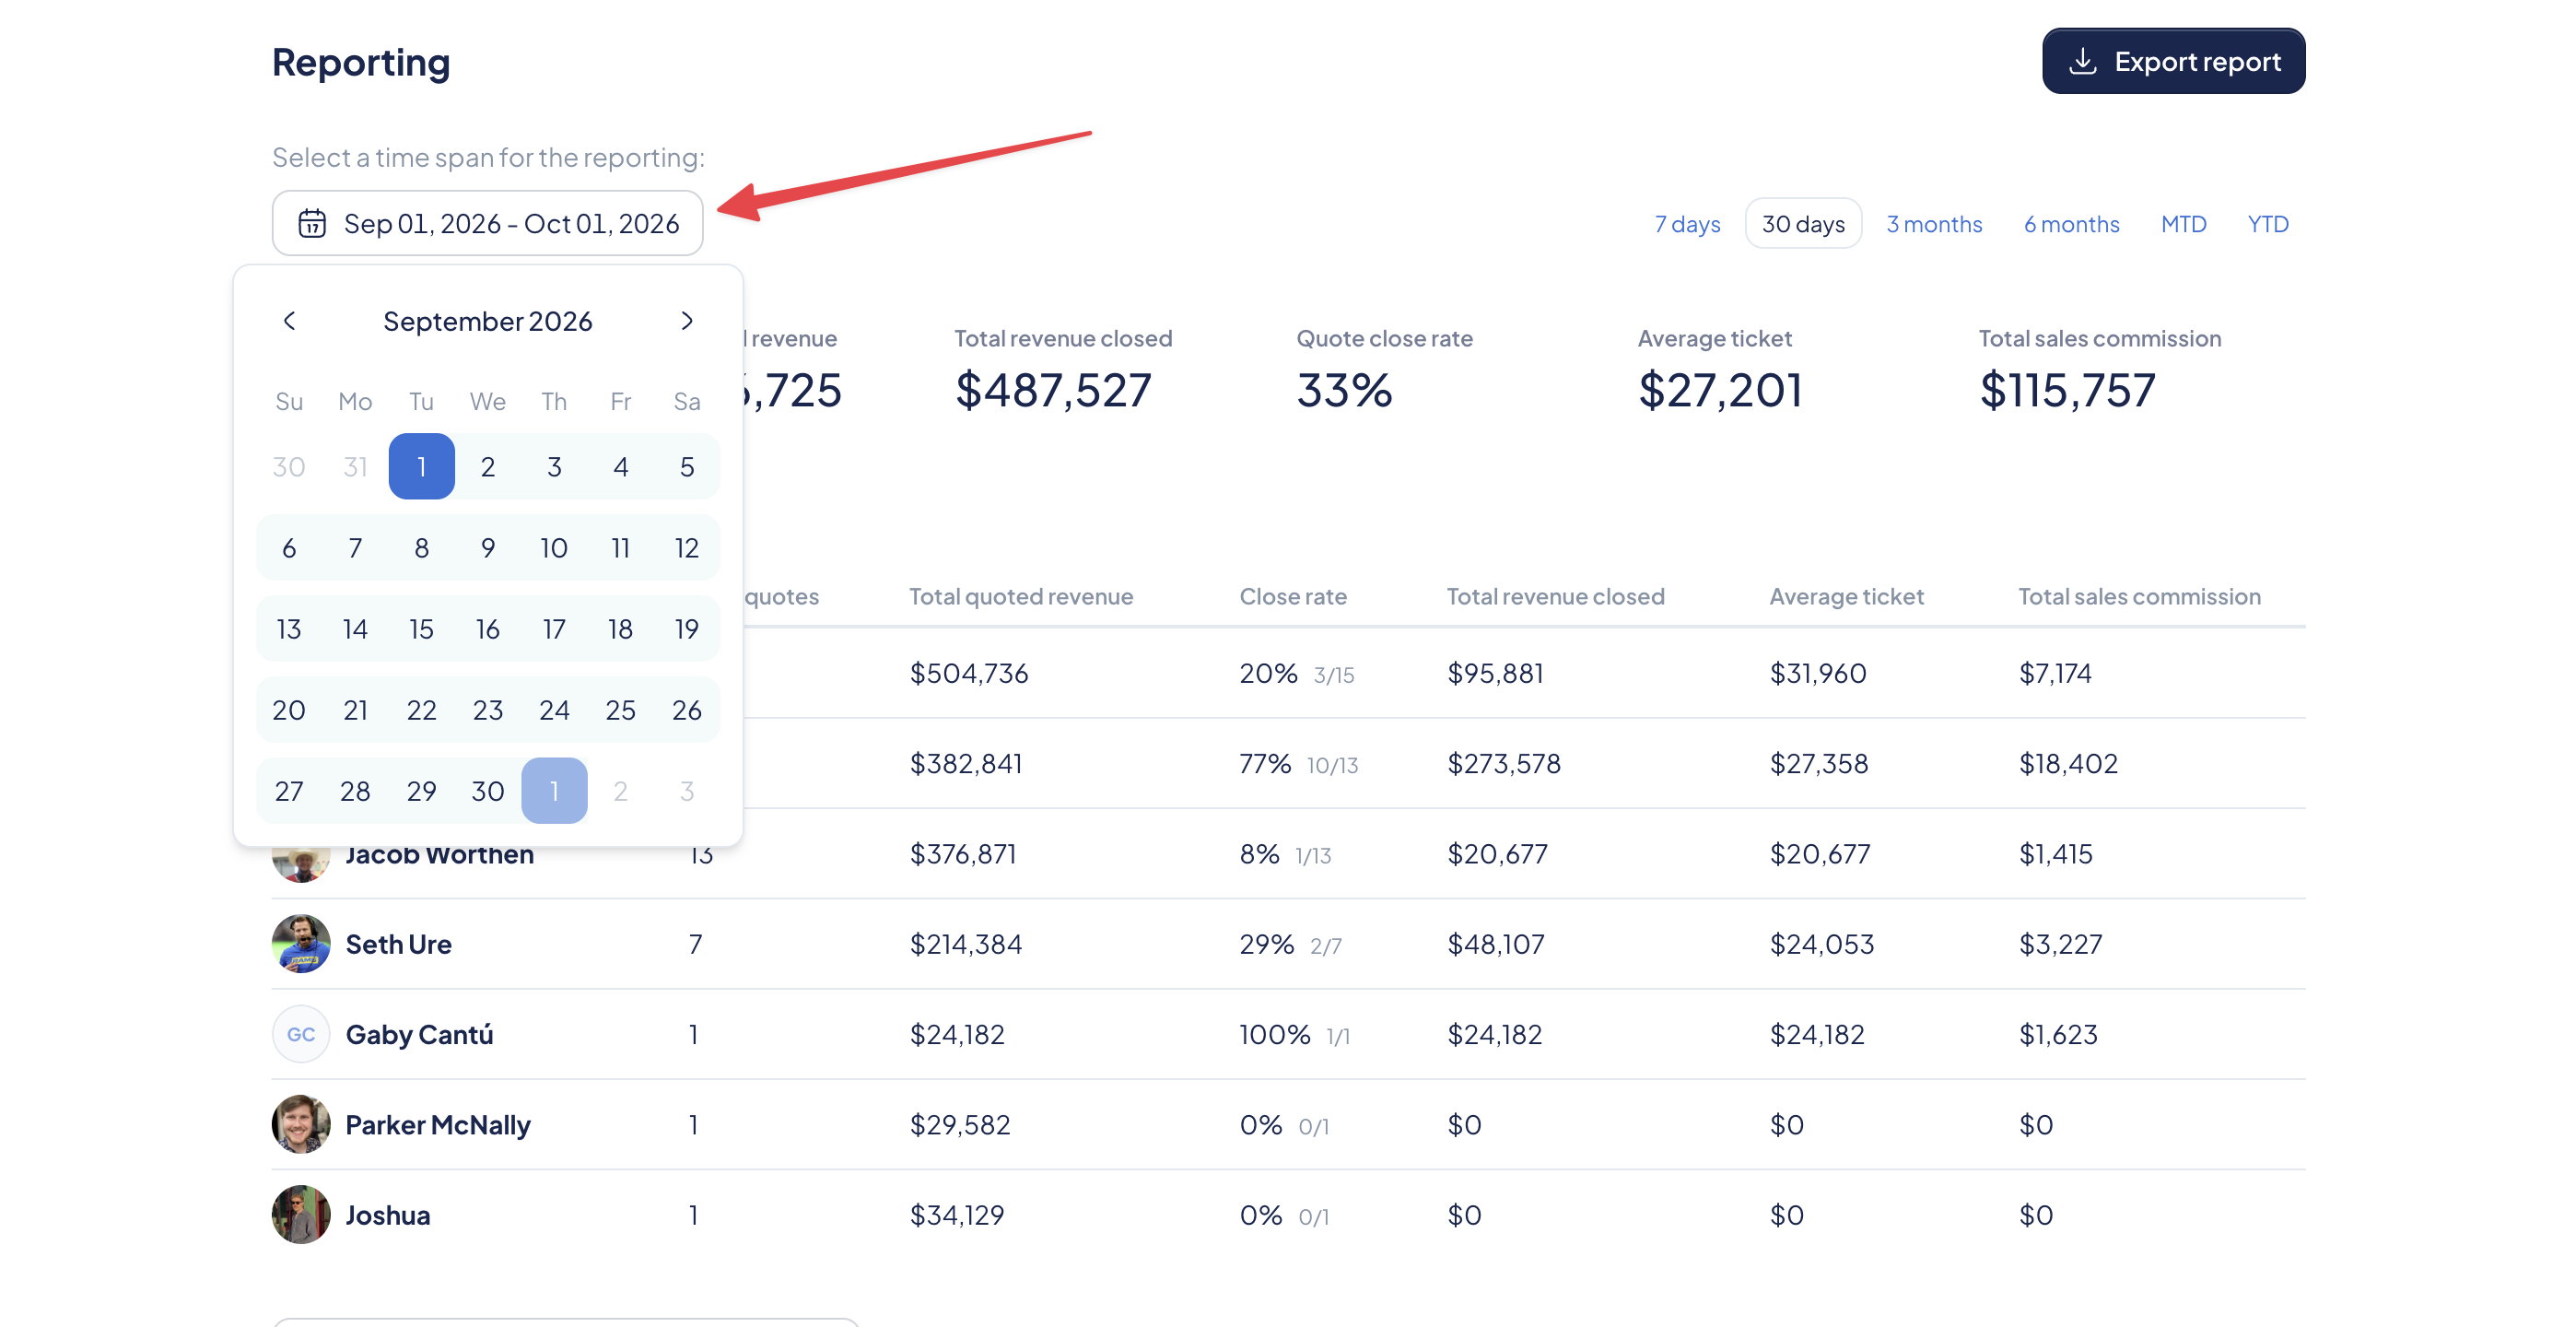
- Custom range: Click the date field under Select a time span for the reporting and choose a start and end date.
Company-Wide Metrics
The top of the dashboard shows six metrics for your whole team:
| Metric | What it shows |
|---|---|
| Total quotes | Number of quotes created in the selected time span |
| Total quoted revenue | Combined value of all quotes |
| Total revenue closed | Combined value of quotes that were signed |
| Quote close rate | Percentage of quotes that closed |
| Average ticket | Average value of a closed sale |
| Total sales commission | Commission earned across your team |
Sales Statistics
The Sales statistics table breaks down the same six metrics for each salesperson.
- Close rate shows both the percentage and the raw count (for example, 20% 3/15 means 3 of 15 quotes closed).
- Use this table to compare performance across your team and identify who might need coaching or support.
Timeline Chart
Below the Sales statistics table, a bar chart shows your activity day by day. Each salesperson has their own color, listed in the legend above the chart.
To change what the chart shows:
- Click the dropdown above the chart.
- Select a metric:
- Total quotes
- Closed quotes
- Total quoted revenue
- Total sales commission
Quote Locations Map
At the bottom of the dashboard, the Quote Locations heatmap shows where your quotes are being created. Warmer colors (red) mean more quotes in that area.
- Use + and – to zoom in and out.
- Click and drag to move around the map.
This is a quick way to see which service areas are most active.
Export Your Report
Click Export report in the top right to download the data for the selected time span. This is useful for sharing results with your team or pulling numbers into your own spreadsheets.
FAQs
Who can see the Reporting Dashboard? Any SetSale user can access Reporting.
Why don't my numbers match last month's report? Check your time span. The dashboard defaults to the last 30 days, which is a rolling window — not the calendar month. Use MTD or a custom range to match a specific month.
Why did a quote disappear from my metrics? Quotes marked as Cancelled are removed from reporting.